
Graphic: Comparing the 2014 bipartisan budget to 2013

Just months after budget sequestration and a government shutdown put transportation funding at risk, Congress passed the first full budget in three years last night after the Senate vote that will provide stable or increased funding for key programs we’ve been fighting for over the last few years. The $1.1 trillion budget is with the President for his signature. Take a look at this graphic which shows the good news for transportation in this 2014 budget compared to FY2013 figures post-sequestration.

For this graphic and more, don’t miss our regular featured graphics on our Maps and Tools page.

2014 Budget Deal


(Note the comment on the graphic about Amtrak and Amtrak operations — those cuts are a bit deceiving. Also, Amtrak received a total of $1.39 billion in capital and operations for 2014 — as much as they’ve received in almost any recent budget.)

Budget deal avoids automatic cuts; focus shifts to appropriations committees

Barring a successful rebellion within one party or the other, it looks like Congress may have the first bipartisan budget agreement since 2010. That is good news for the economy, and it is especially welcome where transportation infrastructure is concerned.

Through a combination of fee increases, spending cuts, and other changes, the deal allocates nearly $63 billion to offset “sequestration” cuts – by half this year and about a quarter in fiscal 2015 – and to reduce the deficit by $23 billion. Most importantly for transportation, it provides the appropriations committees with the authority to adjust the funding levels within the new overall cap.

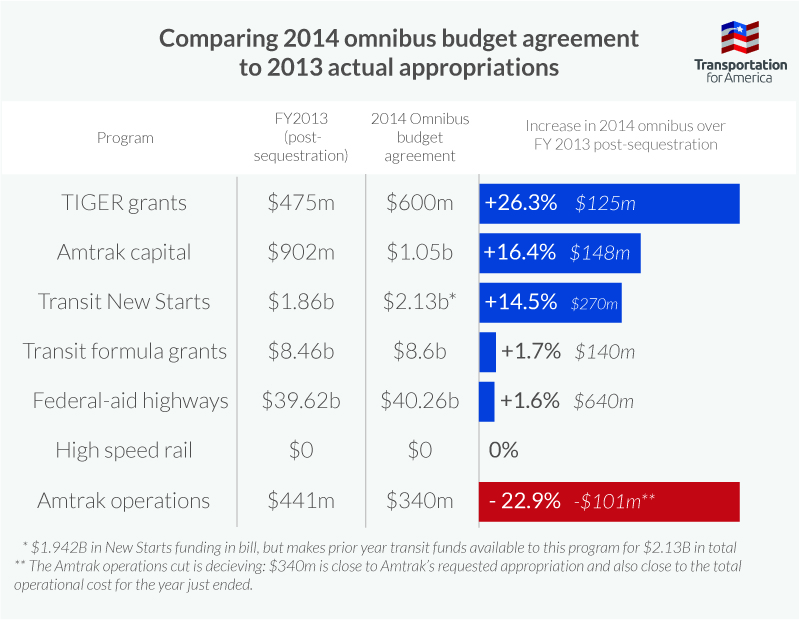
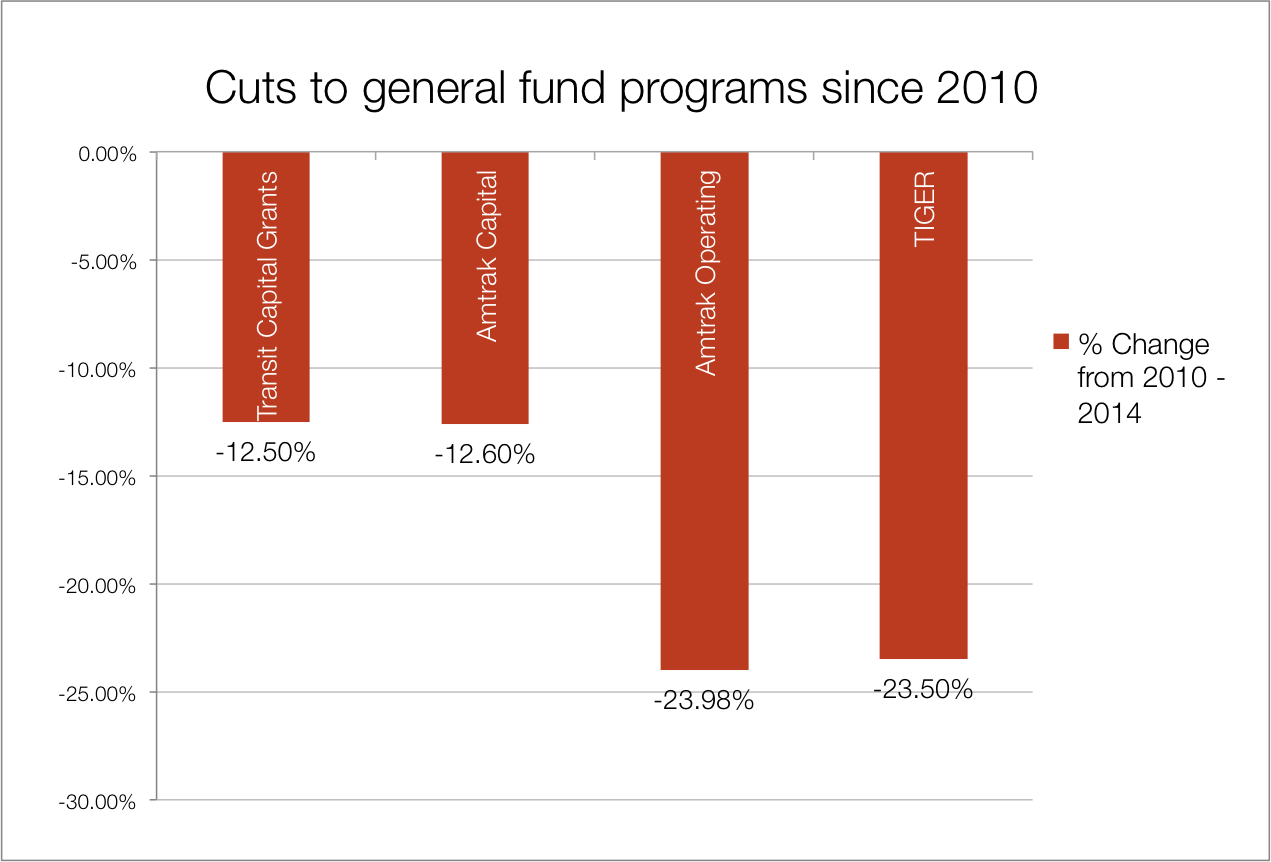
This flexibility opens the possibility of restoring cuts to transit construction projects under New Starts, to the oversubscribed program of competitive grants under TIGER and to Amtrak. Those programs faced cuts of at least 7 percent this year, on top of previous cuts.

Transportation cuts since 2010

The deal also includes a “reserve account” for infrastructure that gives Congress and authorizing committees permission to spend more on transportation and other infrastructure, provided they can pay for it either through cuts elsewhere or increased revenue – by, say, raising the gas tax.  This is good news, because, while it by no means guarantees positive action, the agreement at least indicates bipartisan acknowledgment that more investment in transportation may be warranted.

As we have explained in this space before, relying only on existing revenue from the federal gas tax would lead to massive cuts to highway and transit projects starting next fall.

That’s why we at Transportation for America are rallying local elected, business and civic leaders from around the country to a realistic proposal to raise and invest additional revenue. While one simple route would be to raise the federal gas tax to match inflation since the last increase in 1993, there are other, readily doable avenues available, as our proposal shows.

Raising an additional $30 billion per year – at roughly the cost per commuter of a doughnut and a coffee a week – would allow us to stabilize funding for the MAP-21 program Congress adopted last year and protect all modes of transportation – including New Starts, TIGER and Amtrak – from draconian budget cuts. At the same time, we could spur the innovation our economy needs to meet population growth and rising demand by funding competitive grants to local communities that come up with smart solutions.

The budget deal offers a glimmer of hope that members of both parties will understand what is at stake if transportation funding continues to be radically unstable. We hope that Congress can continue to work in a cooperative, bi-partisan fashion to address key needs like the impending insolvency of our federal transportation program.

The impacts of sequestration: comparing 2012 to 2013

If your head is spinning from trying to figure out what sequestration, the “continuing budget resolution,” and the myriad proposed budgets have on transportation funding, this simple chart is for you.

This helpful chart shows the notable recent spending plans and compares each of them to what was spent on transportation in 2012, for the key programs that we care about.

There’s still a lot there, so let’s break down what’s there and simplify it. The first column shows what was approved for spending in 2012. These appropriations bills were passed before MAP-21 passed last summer, so 2012 mostly represents the levels authorized by SAFETEA-LU. This is the baseline we’re using for comparing to the 2013 spending.

The second column is the 2013 budget proposed by the Senate in the last (112th) Congress.

The third column is the spending levels established by MAP-21. Keep in mind that the standing transportation law just “authorizes” funding levels — the money still has to be “appropriated” each year. But typically, appropriators follow the levels laid out within the current transportation law for the most part.

The fourth column is the important one to pay attention to, because this is where all the cuts that are part of “sequestration” have been made. This is the “continuing budget resolution” that the Senate and then the House passed in just the last few weeks. A CR, as its known, just extends spending authority ahead through a certain amount of time — usually when Congress can’t agree to write a proper new annual budget before the current one expires. It’s a stopgap measure. A CR usually keeps funding at the same level and almost never changes policy, but in this case, there are cuts in the CR, and most of these are due to sequestration, which required cuts to all discretionary funding.

The last column shows the difference between the funding for transportation in 2012 vs 2013, comparing the first column with the fourth. Hopefully this provides some clarity for a confusing issue.

Would you like to download this chart as a sharable PDF? Find that here.

Program2012 funding levelsSenate's draft 2013 proposal (112th Congress)MAP-21 authorized2013 CR (implements sequestration)Difference: 2013 v. 2012 funding levels
Federal-Aid Highways$39.1B$39.1B$39.7BB$39.7B$600M
Transit Formula Grants$8.36B$8.36B$8.5B$8.5B$10M
Transit Capital Grants (New Starts)$1.955B$2B$1.9B$1.86B—$95M
High Speed Rail/High Performance Passenger Rail$0 (HSR)$100M from PRIIAPRIIA has jurisidction$0$0
Amtrak Capital*$952M$1.05BPRIIA has jurisidction$904M—$48M
Amtrak Operating*$466M$400MPRIIA has jurisidction$442.5M—$23.5M
TIGER$500M$500MNot authorized$475M—$25M
Partnership for Sustainable Communities Grants$0$50M$0$0
Projects of National and Regional Significance (PNRS)Did not exist – created under MAP-21$500M$0$0 (or —$500M from MAP-21)
Hurricane Sandy FTA Emergency Transit Funding$10.9B$10.35B—$545M
Hurricane Sandy Amtrak Emergency Funds$118M$112M—$6M
Hurricane Sandy FHWA Emergency Highway Funds$2B$1.9B—$100M