Posts Tagged "graphic"
Pro-tip: Invest in the solution, not in the problem
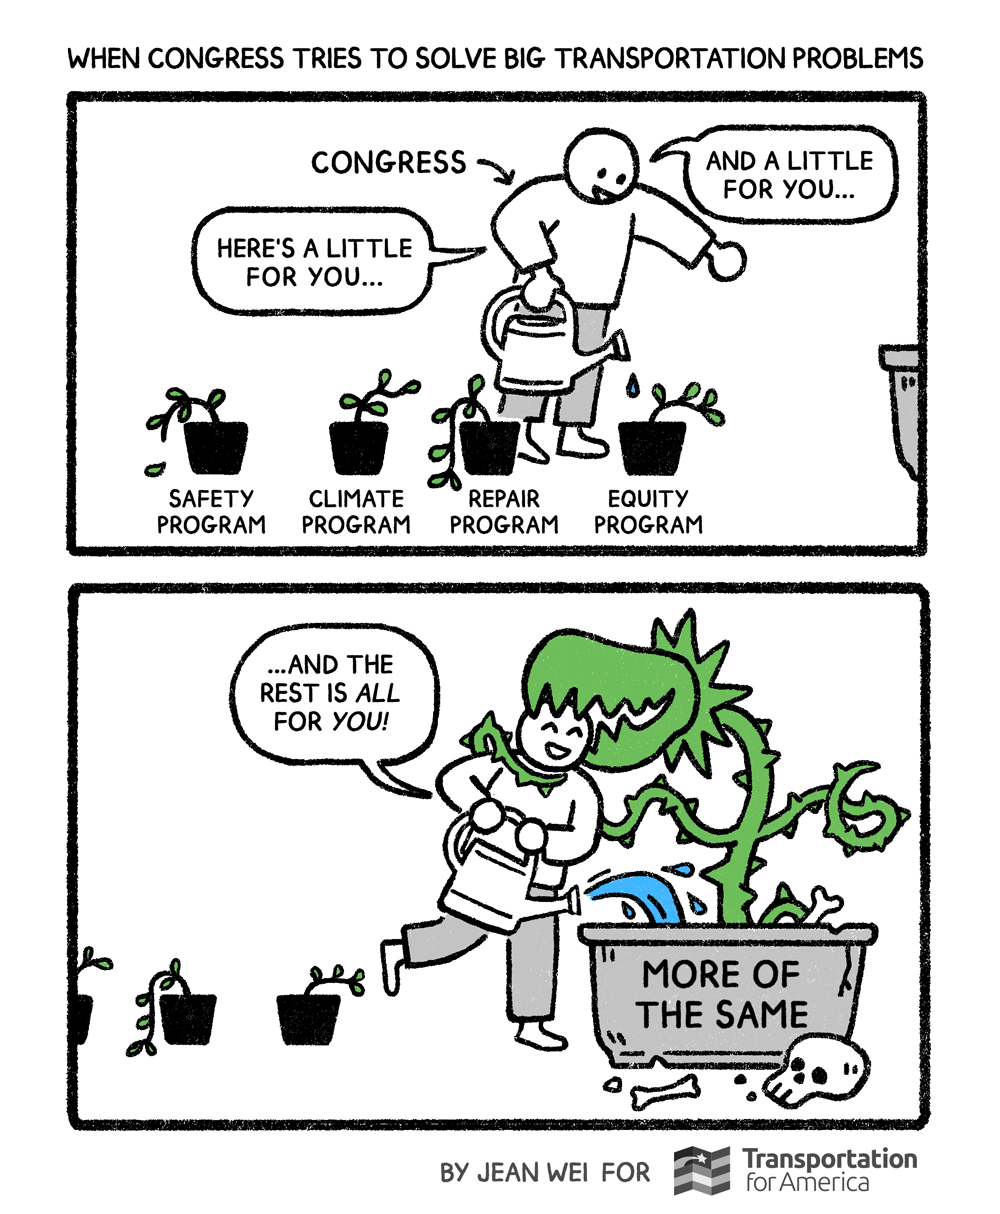
Congress and states love to create small, discrete programs to solve big transportation problems. They do not like to stop the types of investments that are causing the problems, even when far more money is perpetuating the issues those new programs are meant to solve. With historic amounts of infrastructure funding headed into states’ hands even as streets are growing more dangerous and we urgently need environmental solutions, it’s time to change that strategy.
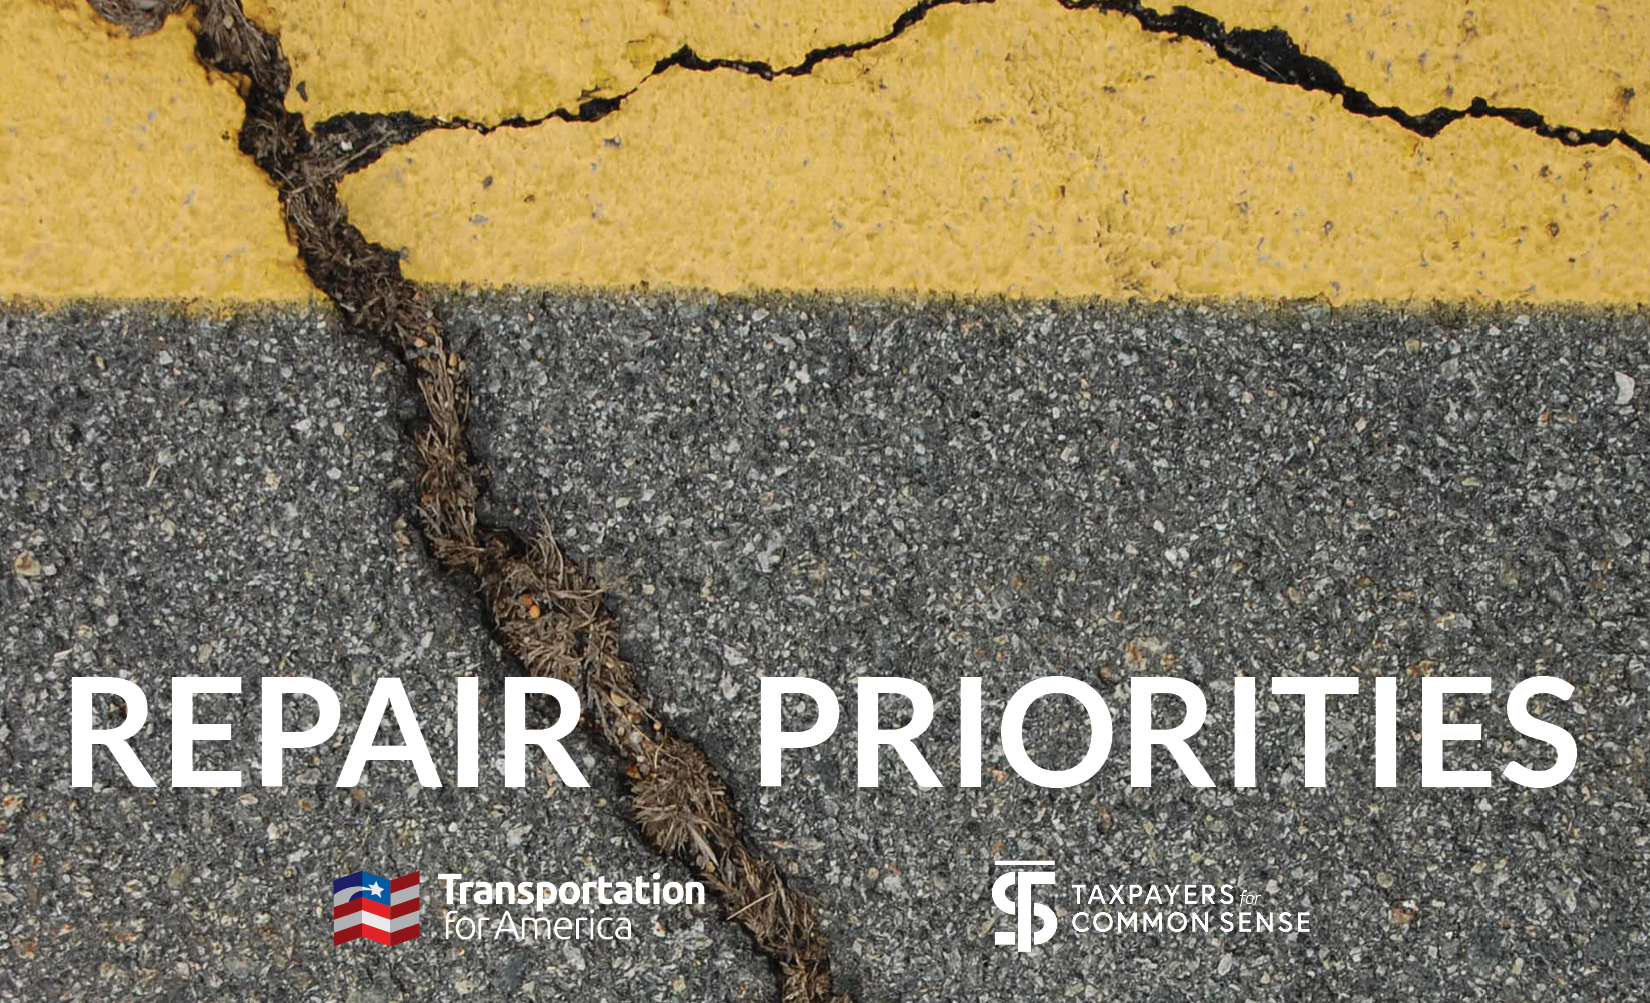
Everyone agrees that repair is important. No one is willing to require it
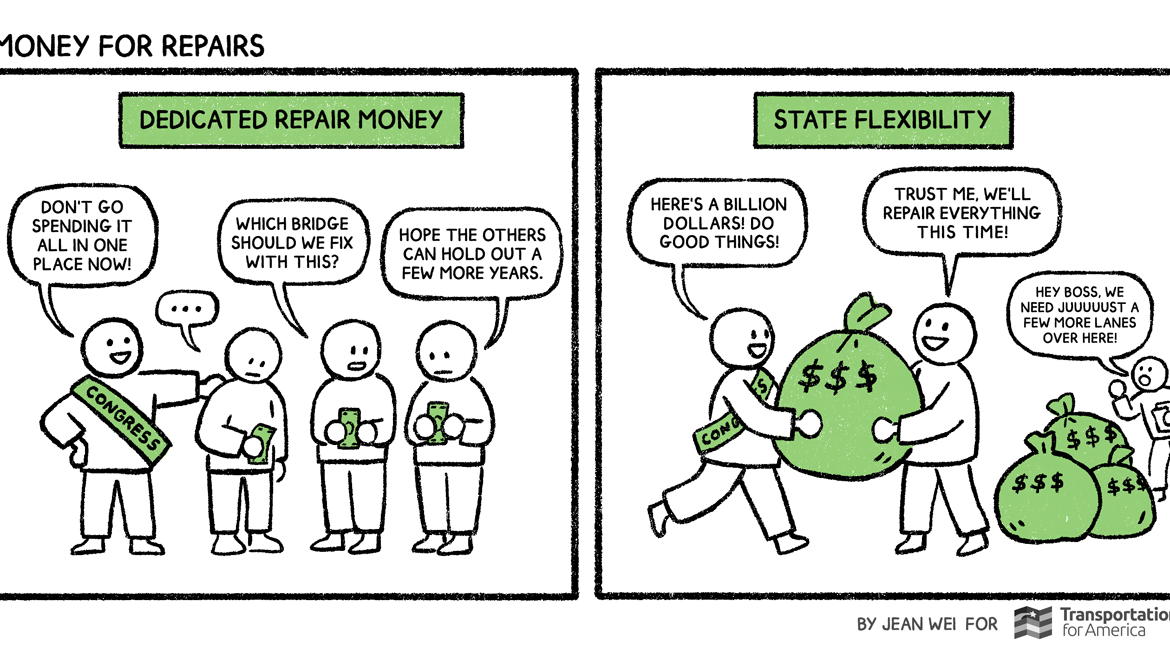
Despite a fundamental lack of understanding by some members of Congress about the program they’re responsible for overseeing, the law sets states free to spend their federal transportation cash on eligible expenses, however they see fit. Our repair needs will never get addressed until we change this approach. Every time that we’ve polled voters over […]
Show me the money: Financial breakdown of the infrastructure law
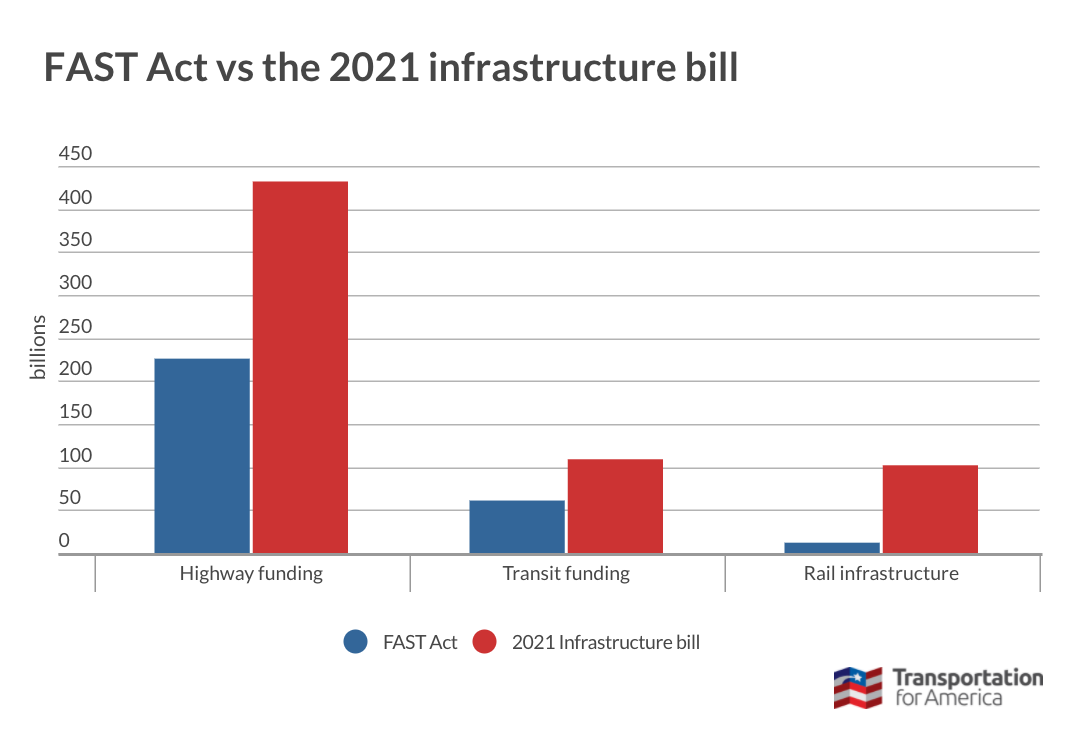
A month has passed since the $1.2 trillion infrastructure deal was signed into law. There is much to unpack as to exactly how much money there is for the surface transportation program and how it can be used.
‘Speak up for transportation’: Analyses show the devastating impact of federal cuts
Congress has seen various proposals floated to scale back federal investment in transportation, from cutting out transit funding to ending the federal gasoline tax and shifting full responsibility to the states. We decided to take a look at what that latter move would mean for taxpayers, who would have to make up the difference in each state or accept multi-million dollar decreases in funding and deteriorating conditions on an annual basis.
Voters overwhelmingly re-elect candidates who raise transportation revenue, analysis of general election results shows
Continuing a trend observed in the primaries, an updated T4America analysis of November’s election data shows that, since 2012 in ten states that passed legislation to raise new transportation revenue, 90 percent of the supportive legislators retained their seats — knowledge that should be instructive for the legislators in 17 states now considering similar plans to raise state transportation revenue in 2015.
Graphic: Comparing the 2014 bipartisan budget to 2013

Congress passed the first full budget in three years last night after the Senate vote that will provide stable or increased funding for key programs we’ve been fighting for over the last few years. Take a look at this graphic which shows the good news for transportation in this 2014 budget compared to FY2013 figures post-sequestration.
Graphic: A closer look at the Senate MAP-21 vote by state
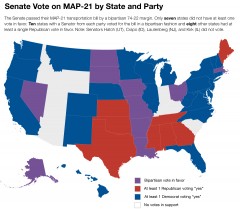 As this map and graphic below amply demonstrates, the Senate’s transportation bill not only was developed with bipartisan input and adopted with votes from both parties, but it garnered support from every region of the country and from the reddest of “red” states, the bluest of blue, as well many others that trend purple. This is a noteworthy accomplishment in this Congress, and one that House leaders should take note of before dismissing HR 14 out of hand.
Summary of the Senate MAP-21 transportation bill proposal
The Senate Environment and Public Works Committee released a draft of the transportation bill late last Friday. We’ve prepared a few pages on what this draft bill propose to do to the federal transportation program. This is a bit on the wonky side, but hopefully you will find it helpful if you’re trying to summarize the 600 pages of bill text. One of the most visible changes MAP-21 makes is to restructure seven core highway programs and 13 formula programs into just five core programs.
Correcting some misinformation on bicycle and pedestrian spending
Bike and pedestrian projects get less than 1.5 percent of federal transportation funding — despite recent misinformation to the contrary. There’s some misinformation percolating about the size of the transportation enhancements program — the small dedicated program that has funded projects to make biking and walking safer and more convenient for 20 years. Some misleading […]
USA Today on infrastructure spending: what do Americans want?
USA Today had a timely graphic up yesterday, considering the continuing media coverage around President Obama’s recent proposal for infrastructure spending and a reformed long-term transportation bill. Though we can’t see the rest of the questions or the context, it affirms a few things we already know about Americans’ attitudes about transportation. They want more accountability, safer streets, and more transportation options so seniors can maintain their independence and low wage workers can get to jobs.
Where should our transportation dollars go?
USA Today’s “Snapshot”on yesterday’s front page used data from a a poll conducted in January by Transportation for America and the National Association of Realtors. Source: USA TODAY
Our three principles
It’s past time to elevate the national conversation about infrastructure beyond just the price tag.
Learn more about our platformLatest From The Blog


There’s a climate cost to America’s freeways, and…
Apr 23rd, 2024


Progress for passenger rail in the South and…
Apr 10th, 2024

I cannot find the zoom link, I registered…
Jan 6th, 2024

A rare look behind the curtain of Transportation…
Jul 28th, 2023

In what Harrison Ford said was his most…
Jul 25th, 2023

Good example, walking to the local taco place…
Jul 24th, 2023