


Connecting people to jobs and services week: How bad metrics lead to even worse decisions
When the top priority of our transportation investments is moving cars as fast as possible, the end product is streets that are wildly unsafe—as chronicled in depth last week. This focus on vehicle speed and throughput is the result of outdated metrics that utterly fail to produce a transportation system that connects people to what they need every day.
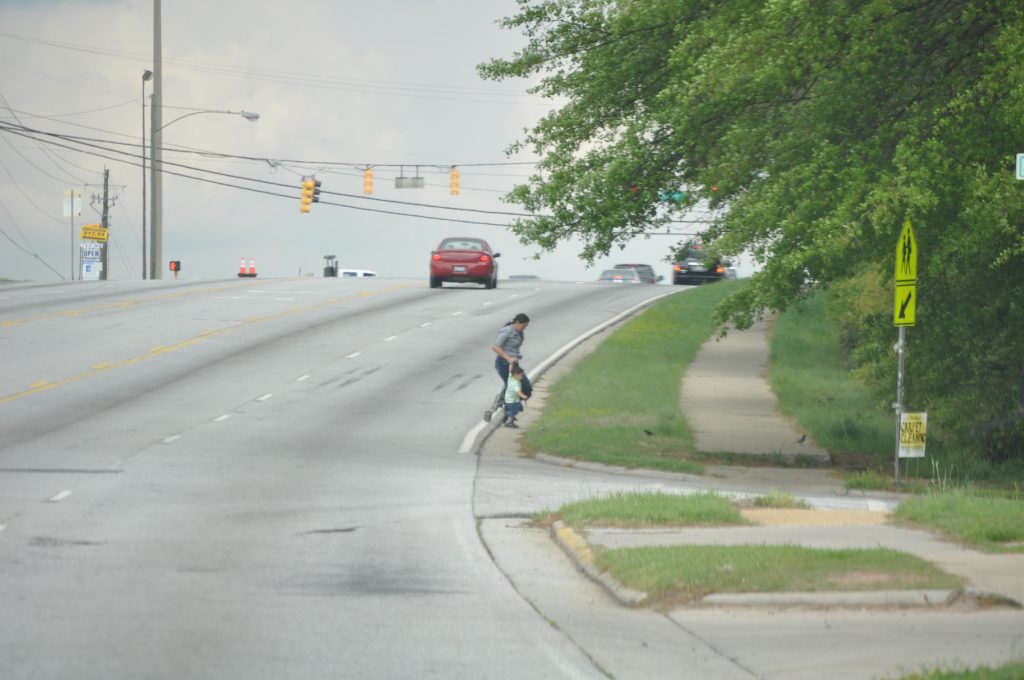
A “successful” street, according to the metrics used by most state DOTs and metro areas. But “moving cars fast” as a goal fails to measure whether or not anyone can get where they are going. We need a better standard for success.
For “connecting to jobs and services” week, which focuses on our last of three principles for transportation investment, we’re re-surfacing portions of a post we wrote in 2016 about how one bad metric for evaluating potential transportation investments leads to expensive road projects that fail to get people where they are going every day.
All this week, we’re going to be unpacking our third principle for transportation investment, which is admittedly the most difficult to explain, especially compared to the first two: (1) prioritizing maintenance, and (2) prioritizing safety over speed. Before we can explain “connecting people to jobs and services,” we need to explain how the current federal transportation system is oriented around all the wrong things.
As we chronicled two weeks ago, if there are any existing priorities for the $40+ billion in annual federal transportation investment, it’s that cars should move fast, at all times, on all types of roads, no matter how many people die as a result. But we do almost nothing to measure whether or not any of this federal spending actually helps people get where they need to go each day. One reason why is this wonky metric—created by the federal government—that nearly every state and local transportation agency uses to evaluate the success or failure of their transportation network.
Bad measures for success lead agencies to make bad decisions
As they plan projects and decide which transportation projects to fund, state and local transportation agencies exhaustively measure something called “vehicle level-of-service” for almost every single investment. Here’s a story to illustrate:
Wanting to rejuvenate their local economy, a local community cooks up plans to redesign the local street running through downtown that was perhaps even short-sightedly widened or converted to one-way travel in the 1960s or 70s. They want to make it safer and create a better environment for doing business—to make it a place to travel to, not through.
But because the street is also a state highway, they soon hear from the state department of transportation (DOT) that their proposed changes will slow down traffic and fail to meet “level-of-service” requirements. As a result, the project will fail to make the cut of the state’s short list of projects. Worse yet, the community is told that in order to make this street safer and “solve” congestion, they actually need to widen it and smooth out any curves, making it a virtual speedway, undercutting their plans to build a place with more enjoyable places to walk and visit—a framework for creating economic prosperity.
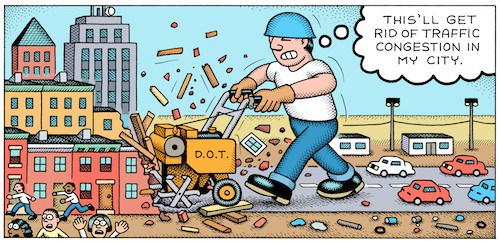
This terrific cartoon from Andy Singer shows how this rationale leads us to obliterate all the good things about our streets and places in pursuit of improving level of service:

What is level of service, and how do DOTs come to this conclusion?
Level of service is a system by which road engineers measure how well a road is performing based on the number of cars and the delay that vehicles experience on that roadway. Letters designate each level, from A to F. Just as with our time in school, A is great, and F is terrible.
A, B and C represent free-flowing conditions and F is stop-and-go traffic for vehicles. The score is assessed based on the highest level of congestion on that roadway, even if it only occurs for a few minutes a day. (To be clear, a street that is nearly empty 23.5 hours of the day can get an F if it gets congested during rush hour.) Traditionally, roadway conditions are acceptable if they score a C or higher on non-urban streets and a D or higher on urban streets.
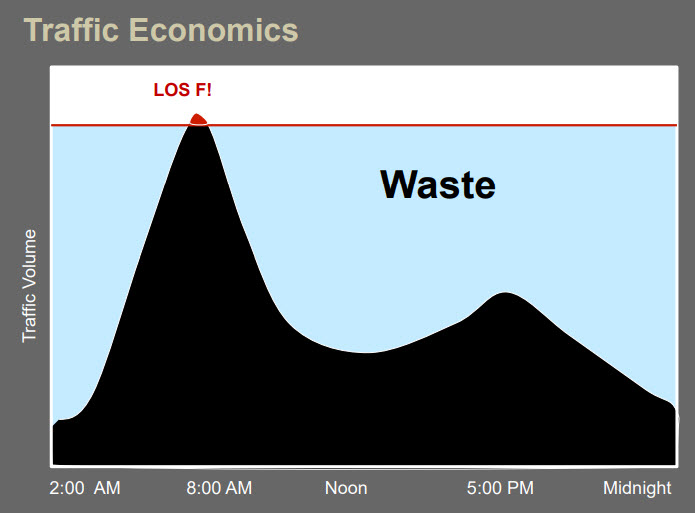
This graphic, created by Jeff Tumlin, the new head of the SFMTA in San Francisco, illustrates how roads can be massively over-engineered to avoid level-of-service “F” with expensive capacity that largely goes wasted during the bulk of the day. Graphic via Strong Towns.
The level-of-service measurement is calculated by first measuring the amount of traffic during the busiest 15 minutes of an evening rush hour. Next, traffic engineers project the amount of traffic on the road in 20 or 30 years to determine if the road has enough capacity to cover the lifespan of the asset. If a road is projected by traffic engineers to lack capacity 20 years in the future—an incredibly fuzzy practice that’s far more art (or more accurately magic) than math—that road still receives a failing LOS grade today, even if the road is adequately suiting capacity needs.
Though there are no formal or federal requirements to do so, most DOTs, metropolitan planning organizations and traffic engineers rely on the level of service (LOS) transportation metric as they plan and design projects, and evaluate which ones will receive funding. I.e., projects that “improve” it get the fast track for funding, and projects that might make it “worse” are shelved or modified.
According to Jason Henderson, professor of geography at San Francisco State University, “Every city I’ve ever come across has some use of [LOS].” Because of the ubiquity of LOS, this largely misunderstood measurement has profound influence on the design of our communities.
This heavy reliance on level of service has dramatically shaped our cities, and it’s why states and metro areas and cities have spent billions to “solve” congestion in a way that has produced dangerous streets, dilapidated downtowns, economic disaster, and long-term maintenance costs that no locality can cover on their own.
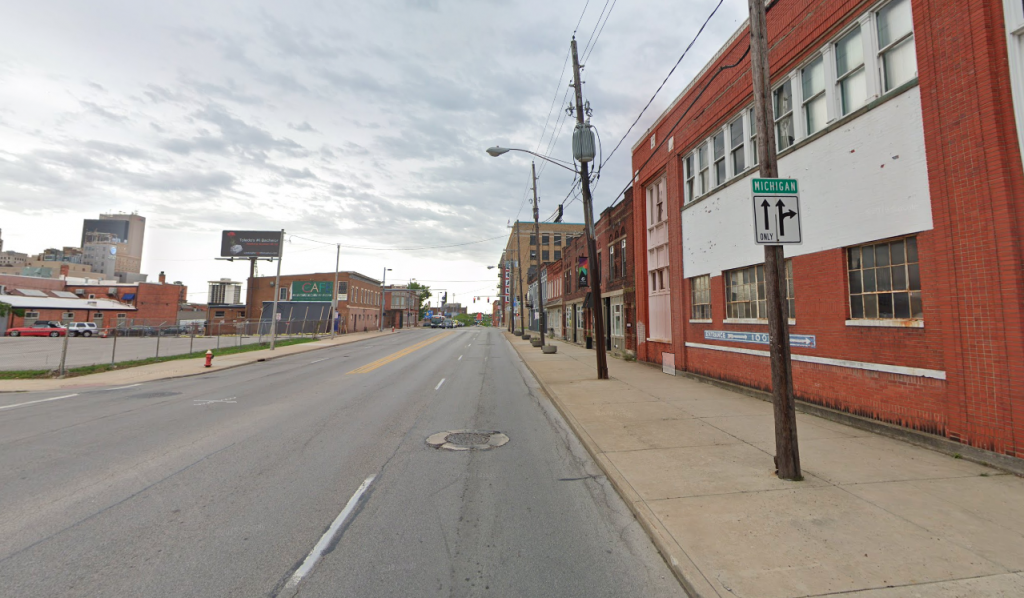
Toledo and many other Rust Belt cities have little to no congestion and many of their in-town streets enjoy level of service “A.” Is that a good measure for success?
As Gary Toth from the Project for Public Spaces brilliantly put it in this piece, transportation professionals, “in search of high LOS rankings, have widened streets, added lanes, removed on-street parking, limited crosswalks, and deployed other inappropriate strategies” all because level of service has been the de facto standard over the last 50 years.
Every great street that you can think of in most places you want to visit on vacation probably “fails” level of service.
Congestion and level of service is “bad” because the street is home to numerous places people want or need to visit, the sidewalks are too wide and filled with pedestrians window shopping, there might be bike lanes to allow people to arrive without a car, and it’s almost certainly chock full, not necessarily of vehicles, but of people.
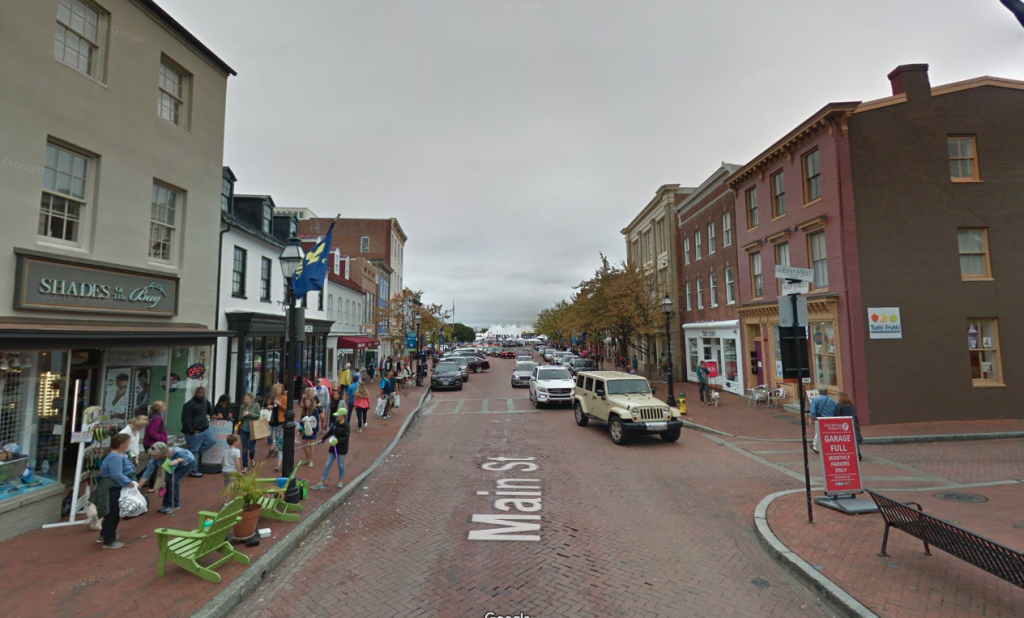
Poor level of service in Annapolis, MD. Tear down those buildings and you could add a couple of lanes in each direction and fix it!
Where did this measure come from?
The 1965 federal Transportation Research Board Highway Capacity Manual introduced this metric and it quickly became accepted as the standard measure of roadway performance. One reason that states adopted level of service so quickly was that it suited our country’s transportation goals in the 1960s of building out a network of interstates and prioritizing automobiles to travel quickly.
But as we explained at length last week, building highways and interstates with speed as the top priority is wildly different from building local and regional streets that create a framework for capturing value and providing for the safe movement of people, whether in a car or not.
Although LOS quickly became the standard, transportation agencies at any level are actually not explicitly required to use it: there are no planning or project design requirements that mandate the use of either LOS or travel modeling. FHWA [in 2016] issued a memo clarifying that level-of-service was never a federal requirement.1 But states persist, partially because the feds have never proposed a better measure of success or a more holistic overarching goal for what our billions are supposed to accomplish.
California was the first to make a notable shift, but more is needed
California set out to change the way they designed their streets and communities by changing the way they measure their performance. In 2013, California legislature passed a law directing the Office of Planning and Research (OPR) to instead measure vehicle-miles traveled (VMT), making it possible for projects aiming to reduce driving to fare well in the evaluation process. In 2013, Governor Jerry Brown signed into law SB 743, eliminating the use of level of service for projects within designated transit priority areas (i.e, areas with decent transit service.)
As Streetsblog LA reported in 2013, because most urban areas fall within the state-defined parameters of a transit priority area, this means that level of service is largely eliminated as a consideration for urban projects. Additionally, SB 743 authorized Governor Brown to develop a new way of measuring traffic impacts of major projects statewide and based the new way on total vehicle miles traveled (VMT) rather than intersection congestion.
Depending on how California implements this, it would change how development and transportation projects are analyzed and scored in traffic impact studies and thus send the state’s billions in transportation dollars toward projects that will help meet the state’s overall goals—rather than projects that will simply keep the cars moving quickly at all costs.
In short, instead of measuring the success of a proposed project by only the limited measure of whether or not traffic might slow for a few minutes per day at rush hour, CalTrans will now measure whether or not a project contributes to other state goals, like reducing greenhouse gas emissions, developing affordable multimodal transportation options for residents, preserving open spaces, or promoting diverse land uses and infill development. It is expected that this change will make it easier to build transit projects, as well as bicycle and pedestrian-friendly infrastructure—instead of encouraging more development that works against California’s own environmental and other goals.
$40+ billion is spent each year with no clear measures for success other than “move cars fast”
We need better priorities for federal transportation investment than just “move cars fast, all the time.” A fundamental principle has to be that the people who use our transportation system should be able to get where they are going. That’s where we are going with our third principle, which we’ll be unpacking in another post: “Connect people to jobs and services.” This metric would be a far better measure of success than anything on the books today, and some places are already starting to implement it.
Our three principles
It’s past time to elevate the national conversation about infrastructure beyond just the price tag.
Learn more about our platformLatest From The Blog


There’s a climate cost to America’s freeways, and…
Apr 23rd, 2024


Progress for passenger rail in the South and…
Apr 10th, 2024

I cannot find the zoom link, I registered…
Jan 6th, 2024

A rare look behind the curtain of Transportation…
Jul 28th, 2023

In what Harrison Ford said was his most…
Jul 25th, 2023

Good example, walking to the local taco place…
Jul 24th, 2023

Pingback: Transportation For America – It’s time to define transportation success by what actually matters to people: getting where you need to go
Pingback: Transportation For America – To connect people to jobs and services, we need to measure what matters: people
Pingback: Transportation For America – House bill sets new standard for GREEN Streets