National report and interactive map shows the state of our nation’s bridges
69,223 bridges – representing more than 11 percent of all U.S. highway bridges – are classified as “structurally deficient,” requiring significant maintenance, rehabilitation or replacement, according to a new T4 America report released today, The Fix We’re In: The State of Our Nation’s Bridges.
Those are the facts, and 69,000 bridges sure sounds like a lot, but what does that look like in real terms? Where are these bridges? Does your city or state have a lot of deficient bridges, or does the state do a good job taking care of them? Those questions are going to be much easier to answer with our online tools accompanying the report, launching today at t4america.org/resources/bridges.
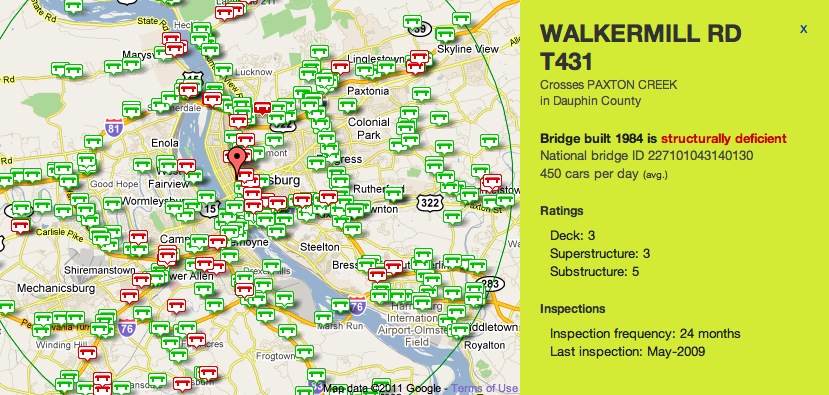
We’ve taken the whole federal bridge database and put it online in a map, so you can type your address, and see all the bridges within a ten-mile radius. Structurally deficient bridges will show up as red icons. Click any bridge and you’ll get more information about it, including its rating in a box on the right.
Curious about how your state stacks up? Click on “By State” and click your state to see a quick overview of their performance, including the best and worst five counties, as well as their rank nationally and total percentage of structurally deficient bridges.
The national report and all 51 state reports are being officially released today at noon with a national telebriefing, but you can go ahead and check out the map and data now on our site. (Media members? Contact david.goldberg@t4america.org if you want information on the telebriefing.)
Check out the map today and please spread the word about it. We’ll be posting several times throughout the day with more information about the national report, which is available for download now — as well as reports for all 50 states and D.C.
 |
Share this on Twitter |
Share | Share this on Facebook |









Pingback: Streetsblog New York City » Today’s Headlines
Pingback: PA Has Worst Bridge Maintenance in America « Construction Knowledge